Table of Contents
Most stuff we do isn’t that important. There are a few things that really matter in order to increase your revenue. You can find them if you are data-driven.
“There are 1000 things you could be working on in your business, but only 2-3 really matter.” Perry Marshall
So how do you figure out which is which?
- Should I develop a new product/ service?
- Should I work on our autoresponder?
- Do I just need more traffic?
- Maybe I should redesign our homepage?
- Do I need to study SEO?
I used to struggle with this.
I used to be really frustrated with developing our marketing and sales funnel.
I’d try new things, they might work, but they wouldn’t have the effect I was hoping for (to increase revenue).
I’d be all over the place with how to improve our marketing – jumping from one idea to another.
I can come up with 10 new ideas before breakfast, and often did. But it wasn’t helping me to make progress.
It felt like I was running through treacle. It was so slow.
I was obviously working on things in the 80% that didn’t matter.
But over the last year, I’ve developed a process for how to choose the next thing to do to improve our marketing and sales funnel and increase revenue. It’s allowed us to improve our funnel consistently week after week (except for one 7-week patch that I’ll explain later). And it’s made a huge difference to our business. It all started with spending more time with data analytics and learning to make only data-driven decisions.
We’ve now got an automated system in place that fills up my calendar with sales calls with excited prospects.
I’m going to explain it in detail below.
How to become data-driven?
I’m sure you have heard about the 80/20 rule.
The 80/20 rule (also known as the Pareto principle) states that, for many events, roughly 80% of the effects come from 20% of the causes.
I learned to use the 80/20 rule to look backwards at stuff I’d done and cut elements that weren’t working. Test 5 things. Cut the 4 worst performing ones. Do more of the top one. Great.
While that is great, and I regularly do that, I always wondered about using it to look forwards rather than backwards.
It’s easy to spend weeks doing data analysis and implementing five different tactics before figuring out which is the best one.
Was there some way of figuring out what thing to work on in advance, rather than using the brute force approach of trying a bunch of stuff then cutting what didn’t work?
Could I figure out “What should I do next?” instead of “what should I stop doing?”
I thought about this many times over the years. I was sure that other people were managing this somehow. But I couldn’t find a specific process to follow.
80/20 Sales and Marketing talks about this a lot, but it doesn’t show step-by-step how to do it.
I found this article by Taylor Pearson useful where he talked about limiting factors.
“I’ve found that thinking in limits is frequently the best way to identify, and do, the obvious.
“Once I’ve defined the problem as a system with constraints or limits, I have the desired outcome that I can think backward from to see what the limits are and re-allocate my energy to address the appropriate limit.”
Taylor Pearson
I also found this article by Nate Smith useful where he said he focused on parts of people’s funnels that are underperforming.
Based on these and my own experience I’ve developed a data-driven process that I use once a week to identify the next thing to improve. An 80/20 SOP if you will.
It’s been life-changing for me.
Through informed decisions, we’ve been making improvements faster than ever in our marketing funnel, so I thought I should share it.
Get Your FREE Personalized Report
80/20 SOP – Basic version
Step 1
Write down the steps in your marketing and sales funnel. Let’s imagine this is:
Google ads —> Landing Page —> fill in enquiry form —> phone call —> sale
Step 2
Write down the conversion rate at each stage. For example:
Google ads $5
Conversion % from click to sign up on landing page = 13%
Conversion % from call to sale = 30%
Total cost per sale $128
Step 3
Look up an ok conversion % for each step.
* Google ads – depends on your keywords, but let’s say you find it $4
* Landing pages – depends on your offer, but let’s say about 20 – 25%. Some get much higher, but that would be an ok number.
* Call to sale – 33%. Really good is 50%.
We’re looking for which one is the easiest to improve considerably.
Google ads are already pretty close to a decent level. Landing page is way under average. Call conversion rate is quite close to average.
So, a data-driven decision would be: the obvious place to focus is on the landing page.
Step 4
Research which elements of landing pages will have the biggest impact. Most people agree it’s:
1. Audience you’re sending there
2. Your offer
3. Headline
Figure out which of these might need improving.
Make a change to that thing and track the results.
80/20 SOP – Advanced version
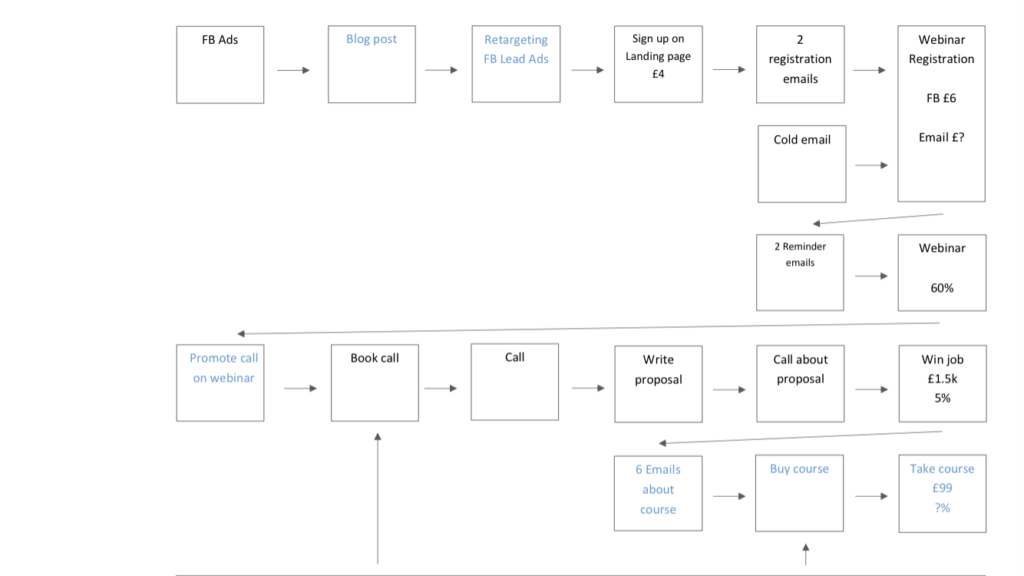
Phase 1 – map out your funnel
Map out your marketing funnel step-by-step on a piece of paper or a whiteboard.
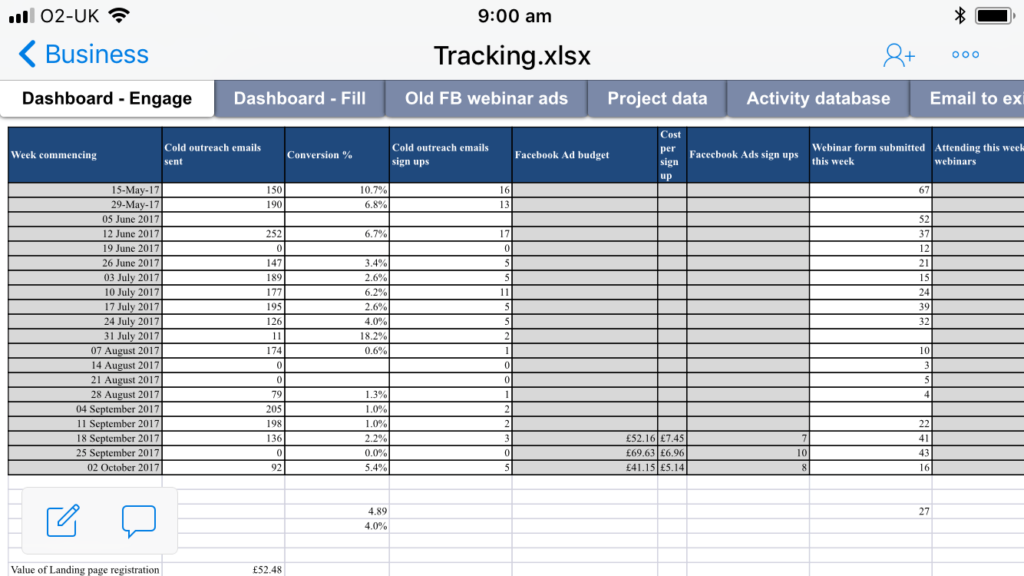
Add each step to a spreadsheet. Here’s a screenshot of the spreadsheet we use each week. If you want to be data-driven, get used to spending time in spreadsheets 🙂
Set up a model which predicts what would happen to your income if you change one of the numbers.
I’ll be honest. This is where it gets a bit mathsy. If you’re not comfortable with percentages or Excel then this might be hard work, so I’ve included a copy of our spreadsheet for you to start from.
Here’s a copy of the spreadsheet we use each week.
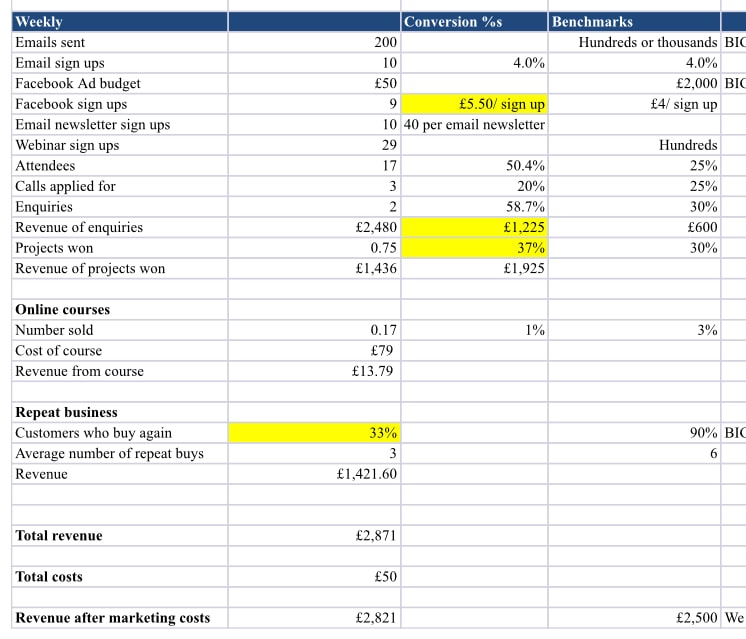
Here’s how the numbers work
- revenue line at the bottom = revenue of enquiries x 75% (average % of projects that are won)
- Enquiries = calls x 58% (average conversion percentage from call to enquiry)
- Calls applied for = webinar attendees x 20% (average percent who book a call)
- etc.
The model we use is in the second worksheet of this spreadsheet.
Find relevant data for what other people with as similar a business as possible are achieving at each stage, and put a benchmark level of what you think should be possible to achieve (not the best of what others are getting, but something that seems totally realistic).
Step 2 – identify which area to focus on
Identify which of your numbers is furthest from the benchmark.
Try analyzing data and changing that number in the model and see what happens to the revenue number at the bottom.
Make a data-driven decision: if it has a big effect on your income then that’s probably the area to focus on.
Check that if you change that number, it won’t cause problems elsewhere (e.g. you can increase number of enquiries, but you don’t have time to deal with any more enquiries).
If there are a few contenders then you also might want to change that number back and play around with changing other numbers.
So we might start by saying that we want to make more sales, but by the end of this phase we should have much more accurate data and a specific focus.
For example, this week I’ve identified that we have good numbers of people registering for the webinar, attending the webinar, staying to the end of the webinar, signing up for a sales call and making an enquiry, but only 36% of them buy, and other people are achieving as high as 80% conversion rates from enquiry to sale. This makes me think I could get to 50% reasonably easily.
I also looked at what happened if I tripled our ad budget. According to the model, this would increase our income dramatically, but I only have 13 slots per week for calls, and that would take me over that 13 number. That suggests that the number of slots for sales calls is another limiting factor we could look at that would make a big difference. Maybe next week.
Step 3 – Narrow in more on the problem
So we’ve used the 80/20 rule so far to find what the top area is. Let’s use it again to narrow down to the highest impact element of that area. The one most likely to make a difference.
This is the least well-defined step of my data-driven process. I currently do this through a combination of data visualization, meditation, research, and editing.
I’ll write out the problem as clearly as I can. I’ll then meditate and get my head as clear as I can. Then I’ll read back through the problem and edit it till it’s clearer. I’ll then do some research into data quality and figure out where we’re weakest in that step. Then I’ll read back through the problem and edit it till it’s clearer.
I might repeat this process about five times over the course of several hours. This is quite time-consuming, but I’ve found it’s worth it because it gets me narrowed in on that top, most effective action.
For example – in the last phase I got to the point where I knew I wanted to increase the conversion % of enquiries to sales from 36% to 50%+. What is the current problem?
I went back through our CRM to look at all the jobs we didn’t win, and identified as best I could what we should have done better. I got this down to 3 things:
– I haven’t followed up with some of the people who didn’t buy, and they still might buy. The reason I didn’t follow up is the task for following up either didn’t get added or was lost with too many other tasks in my CRM
– I didn’t follow my own sales call system every time because there are some bits that aren’t mapped out precisely and because I couldn’t always remember every step
Other things that I looked at were whether to offer bonuses to make our proposals a better offer. Or to focus on how to build more rapport with clients.
I can definitely be better at building rapport, but I’m pretty good already.
I could definitely test adding bonuses, but this is something where my gut tells me that I could actually make things worse. If I offer our online training as a free bonus to someone who we’re wanting to run a campaign for, then there’s some dissonance there. And I’m not sure what else we’d offer as a free bonus.
Phase 4 – Identify the top options for solving that problem
We’ve used the 80/20 rule to identify the top area, then we’ve used it again to choose the top issue within that area. Now we’re going to use the 80/20 rule to focus in on the top things to do to address that issue.
My next step is to find materials to study on that very, very specific problem and identify what everyone agrees on.
If I can, I find one reliable expert and follow their advice.
If I read or watch information from a few people then I make a note of what they all agree on and start there.
For example – maybe one expert says that to improve the webinar conversion rate you shouldn’t teach, but should focus on inspiring people to believe they can achieve the objective.
Another expert says you should teach as much as possible.
Well – both work ok then. Don’t worry about that.
But if they both agree that you should give a clear and strong call to action at the end. Well – you need to do that.
I’ve found that this stage is a great point to get others involved. If I can put a very clearly defined problem in front of my contacts, mastermind, colleagues or even non-business friends then it’s sometimes possible to identify what to do really quickly.
For example – Heather Shannon from my mastermind was able to identify that I was talking too much in my sales calls and not asking enough questions and I immediately increased the conversion rate dramatically.
Steve Forrester was able to identify that I should implement SMS follow-up in my Facebook Ad campaigns, and we got a huge increase in response rate.
Back to my sales example.
My problem was:
I haven’t gone through customer data and followed up with some of the people who didn’t buy, and they still might buy. The reason I didn’t follow up is the task for following up either didn’t get added or was lost with too many other tasks in my CRM.
I didn’t follow my own sales call system every time because there were some bits that weren’t mapped out precisely and because I couldn’t always remember every step.
So it’s now reasonably straightforward to see that I should:
– Follow up better after-sales calls
– Follow my own data-driven system better = role play sales calls more
– Map out every step of sales call better (e.g. write up answers to objections)
How can I do those things?
I watched this video from Chet Holmes about following up with prospects. He explains the process he recommends for effective follow-up. I copied that and added a step to tag these follow-up tasks with people who made an inquiry as important so I do them first.
I watched another video from Chet Holmes about the sales process and identified that I don’t have enough questions about the prospects’ pain points in my sales call script. I ask one question, but then don’t dig deeper.
I went back through the last 20 projects we didn’t win and wrote up answers to the most common objections.
Then lastly, I added a task to practice my sales call script every week.
In this process I also identified that I could probably improve this sales process by adding in bonuses and improving my close. But they aren’t solving the very specific problems I identified.
Phase 5 – Check if it’s the smallest possible thing
What I’ve learned about making business decisions is that if I change anything big then it will take me longer to implement it, and it’s more likely that it will have an adverse effect on something else in my funnel.
Whenever you change something, it affects other things. We want to make the most laser-targeted improvement possible.
I, therefore, gather data and identify the smallest possible thing I can do to fix the specific problem I identified.
By just changing the smallest possible thing, I’m taking the 80/20 rule to the next level.
Most results for the least effort. That’s what 80/20 is all about.
Looking through what I chose I think those things are quite straightforward. So I’ve not got anything to cut, but normally I have a few things here to cut back down to size.
Phase 6 – Check it won’t break anything else
I found that if I made changes to two consecutive steps in my funnel it made it more likely they could affect each other and cause an issue. I also found that it was harder to tell which thing didn’t work if one of them turned out to be a bad idea.
For example, when I automated the webinar and changed the call to action in the webinar then one didn’t work, but it took me 7 weeks to identify what the problem was. 7 painful, frustrating, weeks.
I’ve therefore started to only change things that are further apart in the funnel. I don’t have a hard and fast rule over how far apart the two parts have to be before changing, but quite a long way apart is the way that I’m thinking about it.
Results this has got me
For me this has been incredible and it’s meant that every week I’ve made an improvement to my marketing funnel that had a clear and obvious effect.
Avoiding temptation
On average this takes me 5 hours to figure out. I’ve found it’s really tempting to just come up with an idea and start working on implementing it. But that thing could easily be something that doesn’t have a very big effect at all. So I’m constantly having to remind myself to only work on the things I identify through this data-driven process.
I’ve spent months before working on things only to find out they had little impact long term. 5 hours is less than that.
How about your decision-making process? Do you make data-driven decisions? How do you decide what to do next in order to increase revenue?